Saturday, 20 April 2019

Project Risk Resilience

According to a quick search, the definition of resilient is an adjective to describe people or things that are “able to withstand or recover from difficult conditions.” The condition of being resilient is a key to success in any endeavour and while some people or things have an innate resilience, in general it is something that must be cultivated through experience, training, and planning. Recently, I watched an interview with an ex-Navy Seal, who in his second career has become famous for methods for building personal and team toughness and resilience.  He was asked if he had ever watched the movie “Navy Seals”, a 1990 movie starring Charlie Sheen, and realistic a depiction it was. Obviously, it isn’t, but one main points was that Charlie Sheen saw more action in the brief period that the movie covered than most Seals would see in a career. The reason being is that the Seals spent 95% of their time planning, looking at every possible scenario, and developing contingency plans to ensure they had the best chance of success. The point being, that while Navy Seals are extremely well trained, their missions are successful because they are resilient due to extremely careful planning.
This same approach can be applied to project management to ensure that your project is resilient. Basically to make your project risk resilient you need to include provisions for risk mitigation and plan risk response. Here is how you can make your project resilient.
Step 1. Identify possible obstacles to delivering the project. Ask three important questions. One, what could happen during project execution? Two, what would the impact be to capabilities, cost and schedule if something occurs? Three, what can do about it? During this process, you should identify risks (obstacles), assess them (how likely and ranges of impacts), and prioritize (identify those that have the most potential to affect your project).
Step 2: Create risk response plans. Starting with your highest priority risk, determine the best strategy for reducing its impact on the project. Commonly, these strategies are defined as Avoid, Transfer, Mitigate or Accept. Avoiding or transferring risks often means changes to project scope. Mitigation will allow you to reduce risk impacts, but require spending additional time and resources to achieve this and essentially becomes a cost benefit analysis to developing the most cost effective strategy for reducing risks. The post-mitigated impact of the risks, plus the impacts of the Accepted risks are residual risks that must be accounted for in your plan.
Step 3: Identify and assign uncertainties to the your plan. Uncertainties are natural variances that are unmanageable and affect all activities.  Uncertainties occur during project execution, often due to unforeseen circumstances, but also due to varying conditions that occur during project  execution. As they cannot be managed (like the residual risk), uncertainties  can only accounted for.
Step 4: Run Monte Carlo simulations to generate risk adjusted schedule margin and cost contingency. Running the simulation will generate range of outcomes for cost and schedule. Using these probabilistic ranges, you can generate schedule margin and cost contingencies to that give your project a high confidence of finishing on time and budget with the need capabilities. Monte Carlo simulations also allow you to determine efficiency of mitigation efforts and select best mitigation plan.
Using the above steps, you can ensure that your projects are risk resilient and give your team the best chance to be successful in delivering the promised value to your stakeholders.

Thursday, 21 February 2019

Visualization of Project Risks and Uncertainties

ne of the challenges of project risk analysis is creating visualizations that provide the relevant information in a format that is easily understood by the intended audience. The Gantt chart is a useful format on which to base the results of schedule risks analysis.
Gantt charts may be one of the most recognizable visualizations of project schedules. Developed in the early 1900’s by Henry Gantt, they were first used as a general planning tool for a variety of processes. However, it was not until the 1960s with the advent of critical path and adoption of computer based CPM scheduling tools, that Gantt chart became the primary visualization tool for schedule planning and analysis. We will show how this format can be modified to show the results of project risk analysis using a “risk adjusted” Results Gantt chart. Risk adjusted project schedule is generated based on results of project risk analysis of the original schedule. The Result Gantt chart provides alternative models of a project based upon the results of a Monte Carlo schedule risk analysis. The chart consists of two precedent networks that visualize the original deterministic schedule and the results of the Monte Carlo simulation. These results include both uncertainties in schedule parameters (start time, finish time, duration, lags, calendars) and risk events. Each activity has two bars for the deterministic and simulation results respectively. The bar for the simulation results can be modified to present additional information about the results of the schedule risk analysis. The length of the bar can be modified to represent various levels of uncertainty. Often the default value is P50 or Mean, but these values can be modified to show other levels such as P80, which is a standard level of certainty for calculating schedule margin.

In addition, the ranges and distributions for early and late start time and finish times for each task can be visualized as small triangles at the beginning and end of each bar, which provide a quick overview of the relative levels of schedule uncertainty in each task. You can visualize how risks events are assigned to project tasks using arrows. Arrows can represent threats or opportunities. Their direction, color, and size indicate if they are a threat (down) or opportunity (up), and severity or criticality (color and size). It is possible to link specific detailed risk assignment probabilities and impacts, such that it can be accessed directly from the individual arrows. The result is a rich and easy to understand Gantt chart that provides its audience a quick overview of the results of a project risk analysis in comparison with the original project plan. Event chain diagrams take the idea of a using the Gantt chart to model risk and uncertainties a step further. Event chain diagrams allow planners to identify events (risks) that affect specific activities and model both single events and chains of events (event chains) and identify the critical event chains that will have the most potential impact on the project. Chains occur with one event causes another event or chain to occur. The relationships and potential impact of these events can be extremely complex and because As Event Chain diagrams are based on a Gantt chart format, planners can provide team members and other stakeholder an easy to understand visualization that combines the information about risk model and the resultant analysis.

Thursday, 7 February 2019

Managing Risks in Large Projects

Managing risk is inherent to managing projects. In fact, managing project risk could be considered the single most important aspect of project management as all projects have risks and uncertainties that can are the underlying causes of missed deadlines and cost overruns. While all projects face these obstacles, large projects are especially vulnerable due to complexity. As projects grow in scope, they also experience an almost exponential growth in complexity and a concurrent growth in an exposure to risk events and uncertainties and can result in out of control costs and schedule and project failure. It is therefore critical that additional risk management strategies are put in place to give your team the best chance to be successful. Here is our advice on how to augment the standard project risk management steps when you are managing a large project.


Create a Risk Register
There are many standard formats for risk registers and the basic required data should include name, id, date identified, person identifier, description, owner/manager, pre and post mitigation probability and impacts, response, actions and status.
For large projects, you can include additional information that will help you better understand the scale of the risk and how effectively it is being managed. We recommend that you include current probability and impact, sunrise and sunset, proximity, location or facility, risk response effectiveness, and any other information that can help you to effectively assess, monitor, and control your risks.

Identify Risks
Risks can be both threats and opportunities. Each risk has both a probability of occurrence and potential impacts on project objectives. There are many well-known strategies that you can use including subject matter expert (SME) opinions, brainstorming, Delphi, root cause analysis, etc. In all cases, use a Bayesian approach, that uses historical data combined with new or emerging information to identify and assess risks.
For large projects, use a risk breakdown structure (RBS) as the basis for risk identification. Large projects are exposed to risks from multiple sources and the sheer volume can make it easy to overlook them A RBS breaks down the possible sources of risks (eg. Internal vs External) into smaller easier to comprehend blocks and makes the identification easier.

Assess Probability and Impact
Risks have both a probability and impact. Probability is a percentage between 0- 100 that the risk could occur, but it can also be ranges such as 1 in 2 (very likely) to 1-100 (very unlikely). Impacts to major project objectives (risk categories), such as schedule, cost, quality, and performance can also be assessed. Use probability and impact matrixes that outline how risk’s are assessed. For example if you are using the common 1 -5 scoring method, the matrixes should provide guidance what each score for probability or impact means. For impacts, 1 could mean less than 1% of the budget and 5 would equal more than 20%. Alternatively, these could be based on fixed amounts.
For large projects, we recommend Monte Carlo simulation to quantify the impact of risks and uncertainties on your project. The complexity of large projects creates situations where simple subjective assessments cannot accurately capture the possible range of outcomes. The assessment should include not only risks from the risk register, but uncertainties or aleatory risk, which is risk that cannot be managed but must be accounted for.

Plan risk Responses
Risk responses are actions or groups of actions that your project team will perform to reduce the impacts of risks on your schedule. At a high level risk responses are the strategies Avoid, Transfer, Mitigate or Accept. Each strategy should include actions with completion dates and the person responsible. Mitigation activities can be plotted on a Mitigation Waterfall Chart that presents a time phased visualization of how the planned actions will reduce the risk score.
For large projects, prioritize your risk responses based on expected values. Calculate the expected value for the cost of risks including risk response activities. Managing project risks is a trade-off and involves coming up with strategies that spend scarce resources to reduce cost or schedule. The cost of managing some risks may outweigh their costs and your resources could be allocated to managing other risks.

Monitor and Control Risks
Project risk management is a continuous and iterative process. As part of project status meetings, include a review of your risks and update information as required. During project execution, your list of risks and their priority will change. At the beginning of each major phase of the project, have a dedicated session, a risk workshop, to do a thorough revaluation of your risks, including identification, assessment, and responses for new and emerging risks.
For large projects, perform Monte Carlo schedule risk analysis on a regular basis. Small slippages are often the first sign of a project that is in trouble. While Earned Value will provide the basis for linear forecast of your schedule, it cannot account for future risks and uncertainties. In projects that are beginning to experience issues, risks and uncertainties do not remain static, but often trend upwards. Monte Carlo simulation will provide a more realistic forecast and identify some of the key areas that you can address to bring your project back under control.

Project Risk Analysis for Oil And Gas Projects


Years ago, we worked on team that developed economic and risk analysis software for the oil and gas industry. Like many people we assumed that the energy industry was enormously profitable because of the simple business model that generated large profits selling a product that is an indispensable component of modern society. In fact, what we discovered was that the ROI (return on investment) was relatively modest and generating profits and remaining viable in this industry is extremely difficult. Competition among producers is fierce and finding and extracting fossil fuels is difficult and fraught with obstacles. The modest average ROI that the industry masks an extreme variance where some projects are massively successful while many fail dismally. While there are many factors that can determine the success of failure in this industry, failure to properly manage project risks and by extension control cost and schedule overruns is often a key factor.
Project cost and schedule risk analysis is an important process in the management of energy portfolios.  Capital cost represents about 40 of all costs in the portfolios. Risks can significantly increase costs due to project delays and other cost escalations. Cost escalations of more than 30% are common and especially prevalent in new plays where developers have less experience with local conditions. The impact of risks on exploration projects is even higher; therefore, it is extremely important to identify and manage critical risks as part of cost control measures. 
Risk impacts to project cost and schedule must be analyzed consistently for all projects in the portfolio and propagate towards corporate portfolio management. Risks can have multiple impacts. For example, a risk could be identified due to a safety concern, so while it will affect safety, it can also impact reputation, cost, and schedule. In addition each project can have multiple risks, each which adds more uncertainty to your project plan.
With multiple risks with multiple impacts, identifying and managing critical or the most important risks is key.  Critical risks are those risks which have the most potential to impact key project objectives How much budget and schedule exposure is there due to project risks? Which risks are most critical? How could they affect cost and schedule, and profitability?
This is not to imply that not managing risks is the norm, it isn’t. However, often the method used are inadequate, as the use indirect methods to identify critical risks which are of dubious quality. Qualitative methods are the most subjective and prioritization of risks is unclear as does not take into project schedule and cost models. Traditional quantitative methods model risks indirectly using abstractions such as correlation, which leave the root causes of project uncertainty unclear. It may indicate that a task or group of task have a lot of uncertainty,  but is this because of one risk or many and which risk is the most important? In addition, schedule risk is often ignored as a priority as opposed to minimizing cost risk. However, the cliché “Time is money” particularly relevant in this context as time dependent cost risk is often the main driver in cost uncertainty and budget overruns.
The most accurate method for assessing cost risk is to include schedule driven costs or time dependent costs as part of the analysis. This requires resource loaded schedules that include resource rates and allocations. RiskyProject simplifies this process by combining the two major r components of this process: a risk register and project plan. The risk register allows you to identify, assess, manage and control your risks.
The plan includes schedule,costs, and resources. Project activities have durations, start and finish times, lags, costs, and resources.  Each one of these activity parameters can be affected by risk.

Project risks are events that potentially could impact your project schedule, cost, or other parameters, but you are unsure if they will occur. Risk are characterized with probabilities of less than 100% but more than 0. In addition, risk impacts must be quantified in terms of cost and time (fixed or relative). The risks are then assigned to each activity.
Once the risk assignment is complete, a Monte Carlo simulation is performed and the results can be used to prioritize your risks and also provide a reasonably accurate assessment of the potential unmanaged impact of each risk to the project. This process allows you to quickly identify cost and schedule uncertainty at both the project and activity level and prioritize risks based on their impact on cost or schedule
The next step is to generate mitigation plans for the most critical risks. These mitigation plans can include multiple activities that have planned finish times, owners, predicted costs, and other properties. Once the risk plans have been approved they can be added into the baseline schedule with associated cost and duration and is considered the post-mitigated baseline The simulation is rerun with planned reductions to the risk probability and impacts due to the mitigation activities and also accounts for the cost of the mitigation plans.

Through this process, we can generate the most accurate quantitative comparison of the pre and post-mitigation costs of the project. Depending upon the goals of the management team, this process can be run multiple times to generate a project plan that meets both the companies cost objectives and risk appetite.

Saturday, 24 November 2018

Enterprise Risk Management vs. Project Risk Management

If you are a history buff like myself, you have probably come across the following statement, “Tactics win battles, but strategies win wars” or something to that effect. While I often find that martial analogies tend to be overused in discussions on project management, but I do think it is applicable when the topic is Enterprise Risk Management . Like an army, companies must adopt specific tactics to ensure the success of specific battles (projects), but at the same time support the underlying capabilities of the army (company) through high level planning and execution of strategies to ensure they win the war, or in the case of companies, remain profitable.

In the project management world, project managers are the officers who execute activities and tactics, monitor progress and make adjustments as needed to increase probability of winning the battle of delivering  a successful project.  In reality though, a significant portion of the risks and uncertainties that project managers face is beyond their immediate control and are symptoms of underlying weaknesses/strengths in their organizations capabilities. This type of risk has to be assessed and managed at a higher management level in the company. In this way we can see that risks can form a hierarchy  within an organization, each can have varying effects on different levels (projects, programs, etc) of the company. With this in mind, the manner in which the impact of these risks propagate through the various levels of the enterprise, should dictate the level at which they are managed.

Enter a formalized process of how to manage risks within an enterprise, which can be characterized as a portfolio of programs and projects. Enterprise risk management allows organizations to optimize how and where they manage risks. Some risks, which are specific to a location such a local regulations are best managed at the project level as they may have unique  characteristics that cannot be effectively managed at a higher level.  Manage other risks, such as resources, capital budgets, or changes in market conditions have systemic effects upon the entire organization and therefore need to at higher level in organization.

What this means is a practical sense is you need the capability to manage multiple sets of risks (risk registers) that represent each level in your organization. For example, an enterprise risk register, could include all of those risks that are being managed by the head office, program risk registers would be used to manage program capabilities, and project risk registers would be include risks that can be controlled  at the project level.  In addition, the system should support the ability to modify where risks are being managed based upon their cumulative impact on the organization. A common example we see is resources. Often resource availability is a challenge for project managers whose resources shared across multiple projects. While resource availability may manifest itself in delays at the project level, an enterprise risk management system allows you to monitor the cumulative impact of these risks at a program level and apply appropriate actions to mitigate or alleviate the impacts. If a risk is critical enough, management of the risk can be transferred up to the  program level. This does not mean that a program risk will not have impacts on the underlying projects, but rather responsibility for reducing or resolving it will now be the responsibility of the program manager. In the example above, project managers would still have to account for the possible impacts of scarcity of resources, but would no longer be responsible for management of the risk.

The point of all of this is that Enterprise Risk Management allows you to address those underlying strategic or systemic issues that affect an organizations capability to deliver value, while delegating situation specific  actions or tactics to the level  at which they can be most effective.

Sunday, 4 November 2018

Project Risk Management Software Features

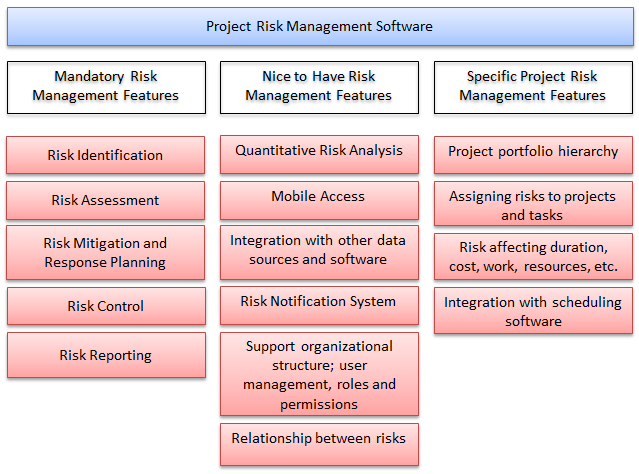
Here is a little experiment that you can try, type “Project Risk Management Software” into Google or other search engine. Not only will you get thousands of hits, but if you examine those that actually link to sites that are selling or marketing software, you will find that they offer a wide range of capabilities. Some are very simple, some quite complex, some look like they are purpose built, that is they are specifically designed for project risk management; whereas, others appear have been included tangentially and offer little clue as to why they were included in the list. With so many solutions available, it can be difficult for someone unfamiliar with this particular topic to separate true contenders from the pretenders. With that in mind, I will now present an overview of what capabilities project risk management software should have. Further, I will separate these out into Mandatory and Nice to Have categories.

Must Have Project Risk Management Software Features
Perhaps the single most important capability provides users a method to identify risks. This identification includes properties or additional data that each risk should include. This data includes: a unique ID, name, date identified, name of identifier, description or risk statement, threat or opportunity, and status (open or closed).

The next set of capabilities required is for risk assessment. Risk assessment requires the capability to add probability and impacts for each risk and impacts must be broken down into categories such as cost, schedule, or performance. The risk assessment should be flexible to support different risk scoring methodologies and algorithms.

You must be able to assign a plan to each risk. Plans can include a strategy that typically is broken out into four categories: transfer, avoid, mitigate, and accept. Risk plans should have steps or activities that will be used to control the risk that include planned date for completion, expected result or changes to the risk score, owner and status.

Each risk should include a record of changes that have a time stamp as well as who made the changes. This can be incorporated with the ability to add notes, comments, reviews, or additional information that can be added to each risk over the course of a project.

Finally, there should be a variety of customizable reports for either individual or multiple risks. Typically, this can include a risk register, risk matrix, and individual risk reports.
Nice to Have Project Risk Management Features
Integration with other project management software is extremely useful. For example, of the risk registers are saved in Excel. The ability to import Excel spreadsheets into your risk register is extremely helpful saving both time and money. If you are performing quantitative project risk analysis, integration with project scheduling and cost estimation tools is invaluable.

For quantitative risk analysis, Monte Carlo simulations are recommended. The Monte Carlo analysis should include the ability to model both risk events (risks) and uncertainties (3 pt. estimates) for cost and resource loaded schedules. The analysis should include a full slate of statistical reports including probability histograms, cumulative probability, and sensitivity analysis. Make sure that the Monte Carlo is designed to run project risk analysis; you should be able to run large schedules (e.g. 1000 activities) in under a minute. Comprehensive quantitative risk analysis should also include additional capabilities such as conditional and probabilistic branching and scenario analysis.

There are probably additional capabilities that we could add to the list, but this is a good starting point for evaluating the quality and capabilities of solutions when you are looking for project risk management software.

Friday, 19 October 2018

Project Risk Analysis Templates

Project risk analysis templates outline the recommended information that should be captured as part of project risk analysis. In many cases project risk register templates are easy to use and at the same time are very useful tools for project risk management and project risk analysis. Project risk analysis templates include:
Risk Breakdown Structure Templates.
Risk breakdown structures are a hierarchical list of risks. Risk breakdown structures help to identify and manage project risks. In RiskyProject you can define different risk breakdown structures at the project level and for each separate task or resource. Each risk is defined by its chance of occurrence, outcome (increase duration, cost, cancel task, etc.) and time of occurrence. In RiskyProject Risk Register you can customize your risk breakdown structure based risk categories, risks, issues, lesson learned, opened and close risks, visible and hidden risks, risk owners, risk managers, and other risk properties. Risk breakdown structure is also implemented for risk assignments with Global Risks view as well as Local Risks tab for each task or resources of RiskyProject Lite and RiskyProject Professional.
Here is standard risk breakdown structures available in RiskyProject:
  • Generic Risk Breakdown Structure. 
  • Software Development Risk Breakdown Structure. 
Risk Properties Template
It is a list of risk properties which can be captured for each risk in the risk register. These default risk properties are implemented in RiskyProject software, however we can always customize the list of risk properties for the needs of your organization. The risk properties templates also include definition of probabilities impacts and scores for different categories, such as Schedule, Cost, Safety, Performance, etc.